Labor Economics vs. Photographic Practice (via Amanda)
So I just wanted to talk a little bit more about what I brought up last class about the relationships I've found between my studies with economics and photography. A lot of what economics is is making assumptions about the behaviors of firms, individuals, etc, to attempt to predict how they will react in certain changes in the market (ie: a shortage in labor supply and its effects on wages, an increase in the price of a good and how it affects the market for that good, etc.) These assumptions are illustrated using various models (usually in the form of graphs) that can then be manipulated according to the change presented to the market.
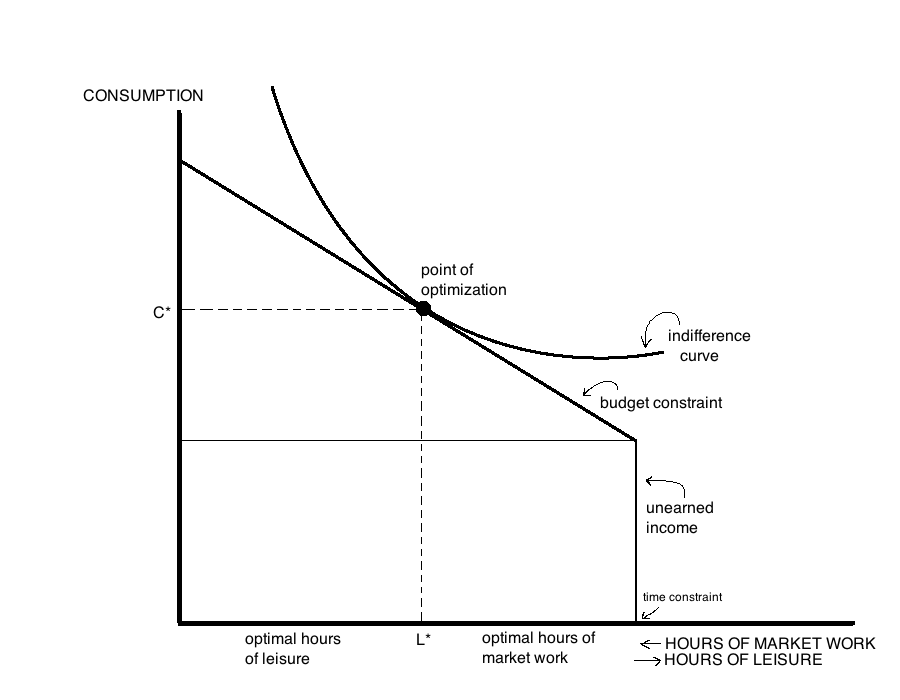
Below is a simple graph I made that illustrates the most basic concepts behind labor economics:
Below is a simple graph I made that illustrates the most basic concepts behind labor economics:
DEFINING A FEW THINGS:
The x axis shows the amount of time spent on both market work and leisure (usually in hours) given in the context of a fixed time constraint. Hours of leisure is read from the left to right (how one would normally expect to read a graph), while hours of market work is read from right to left. They separate at L*, which is the optimal amount of leisure (and thus the optimal amount of market work). As an example, if your time constraint is 24 hours in a day, and your optimal amount of leisure (L*) is 16 hours, then your optimal amount of market work is 8 hours.
The y axis shows your level of consumption, which is the same as your income (one economic assumption for this model is that you will spend 100% of your income on consuming market goods)
The budget constraint line is basically how much money you make (your wage) and determines your level of income/consumption. An increase or decrease in your wage will pivot the budget constraint line (changes the slope) so that you are able to consume more or less, based on the circumstance.
Unearned income is the part of the budget constraint line, but it is income that is given to you as opposed to income that you earn (wages and hours on the job). An example of this would be your grandma giving you $50 a month in a card because she loves you.
The indifference curve is a representaiton of your preferences for (or against) certain goods or services. This can be in relation to two goods in particular, but in this graph it is for all goods in general.
The point of optimization is where your preferences meet with your budget constraint. This is where you get your optimal point of consumption (C*) and leisure/labor (L*)
SOME IMPLICATIONS (AND DISCUSSION POINTS):
The big critique of this model is the separation of market work and leisure. For one thing, leisure is defined as anything that's NOT market work, including yes, vacation and crafts or what have you, but also sleeping, cleaning the house, driving to and from places, running errands, and other things that most people wouldn't normally describe as "leisure" or "fun."
If this is true, then leisure and market work cannot overlap, so according to this model, you can't enjoy what you do for work. I've always thought this is an interesting thing in terms of being an artist, which in most cases is getting paid to do the thing that you enjoy. But this can then also extend to every other occupation - are accountants not allowed to enjoy their jobs either? What if their thing is crunching numbers? What about scientists? You could go on and on.
The interview with Lee Mingwei is what got me thinking about this - he said he considers himself lazy as an artist. Is this because he enjoys what he does and it doesn't feel like work?. If anyone has anything to contribute, please post!!
David: The photo is great! Who took it? The definition of "leisure" as any activity that isn't "market work" (which I assume means work for pay or in exchange for goods or services), does not exclude enjoyment as a tangential benefit of market work. You seem to have concluded this based on the common definition of "leisure" activity as being generally enjoyable since it is activity that we normally choose to do without regard for its economic consequences. Since the economics definition of leisure has nothing to do with it being enjoyable or not, the fact that leisure and market work cannot overlap makes no presumption whatsoever as to whether or not one enjoys their market work. I'm confused by the "indifference curve." You wrote: "The indifference curve is a representaiton of your preferences for (or against) certain goods or services. This can be in relation to two goods in particular, but in this graph it is for all goods in general." Can you give me an example of an indifference curve that is in relation to two goods in particular? Maybe that will help. Thanks Amanda. Very good intro to basic economics. It is already a bit complicated for my brain, so I'm glad it is only basic economics!